Debugging
Whenever your script doesn't the first thing you should look at is the debugger and check for any error messages. You can do that by pressing F12 in the browser. This is what will be shown:
Near the bottom, highlighted in red gives you the information you need. On the left it gives you the error message and on the right it gives you the file name and line number. In the example above it tells you that we are missing a ')' on line 13 in the file errors.html.
Your task
Download the file and fix all the errors.
| errors2.zip |
Debugging the code
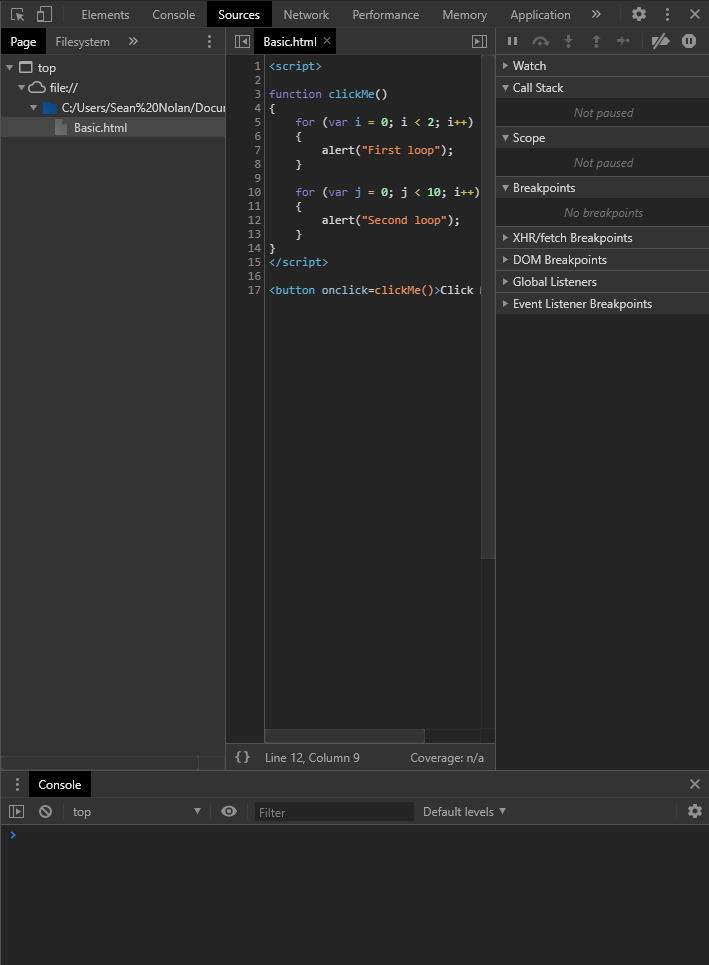
Sometimes you script doesn't work but there are no error messages. That just means that your code is valid but the computer is doing exactly what you instructed it to do. To find out what is going wrong you can use the browsers debugger. You can access it by pressing F12 and click Sources at the top and you will see this:
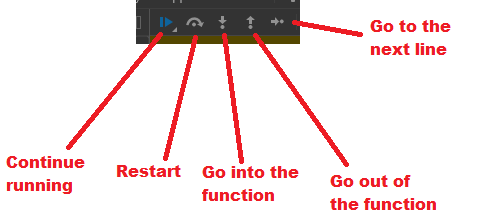
The panel in the middle has the script. Clicking on the line numbers puts in a breakpoint. A breakpoint will stop the javascript on that line. When the javascript reaches that line the buttons near the top right will turn on:
Your task
The file below does not give any error messages but it still doesn't work. Download it and use the debugger to fix it
| errors2.zip |


